

Web scraping @edge, AWS Kinesis Data Firehose & Glue
What is “Web scraping @edge” or “Intranet web scraping”? The ability to extract data from a private website, i.e. from an IoT resource or device that is not publicly reachable. Why should we care? To collect data available only privately and to be able to process them (on the cloud at scale) in order to produce information and insights.
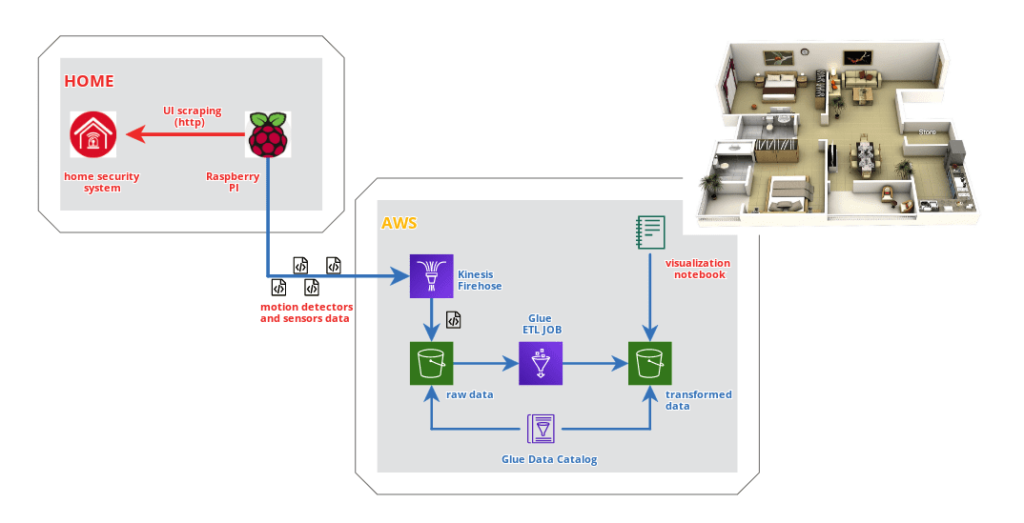
The purpose of this project is the data acquisition from moion detection sensors usually installed for home alarm system. It’s a closed and proprietary system, for obvious security reasons. A Raspberry PI is used in the local network to scrape the UI of Paradox alarm control unit and to send collected data in (near) realtime to AWS Kinesis Data Firehose for subsequent processing. After few weeks of data collected, I played on a Notebook to identify the most used rooms or the most frequent movement vectors.
Let’s see the general scheme.
Project repository is available on Github.
Web scraping with Raspberry PI and Selenium
Having already experience using Selenium, I decided to adopt the same framework in this project as well. Compared to the past, the challenge was to use it on Raspberry PI, an option that led to the adoption of Firefox instead of Chromium, no longer supported on ARM architecture.
The web page of the Paradox control panel (actually its IP150 lan module) looks like the following image.
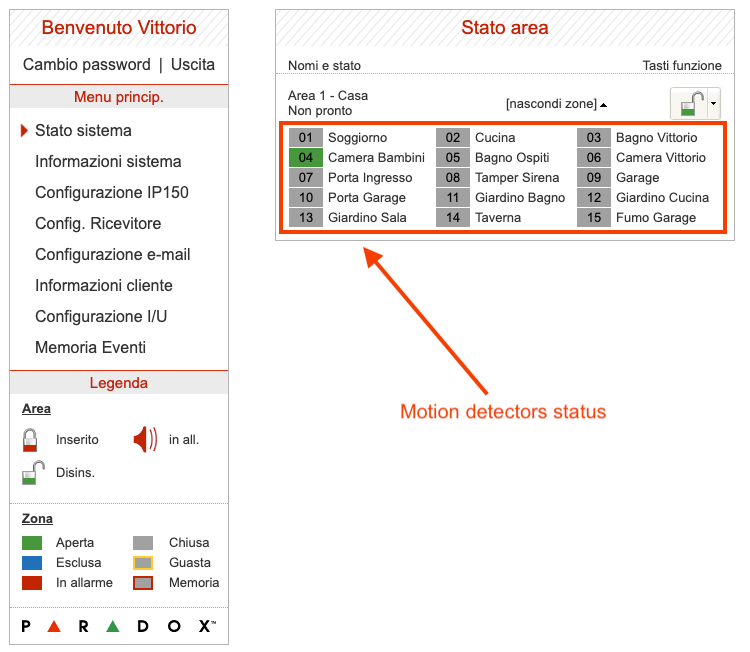
Our purpose is to capture the status of each zone – or motion sensor – in order to collect historical data on the cloud. Since the Paradox system is a closed system that does not foresee the possibility of integration with other solutions, web scraping in polling mode is my only available way.
How to login? As mentioned, we will use Selenium and Firefox in a Python script to automate the operation. Here is an example of the code used.
from selenium.webdriver.common.keys import Keys
from selenium.webdriver.firefox.options import Options
from selenium import webdriver
import os
from time import sleep
from pyvirtualdisplay import Display

def paradox_login():
    # Set screen resolution
    display = Display(visible=0, size=(1366, 768))
    display.start()

    # Open Firefox
    options = Options()
    options.headless = True
    driver = webdriver.Firefox(
                 executable_path='/usr/local/bin/geckodriver',
                 options=options)

    # Open homepage
    ipaddress = os.environ['PARADOX_IPADDRESS']
    print('Opening Paradox at address: {}'.format(ipaddress))
    driver.get('http://{}'.format(ipaddress))
    print('Waiting a moment..')
    sleep(5)

    #Login
    usercode, password = os.environ['PARADOX_USERCODE'],
                         os.environ['PARADOX_PASSWORD']
    print('Login..')
    user_elem = driver.find_element_by_id("user")
    pass_elem = driver.find_element_by_id("pass")
    user_elem.clear()
    user_elem.send_keys(usercode)
    pass_elem.clear()
    pass_elem.send_keys(password)
    pass_elem.send_keys(Keys.RETURN)

if __name__ == "__main__":
    paradox_login()
Once logged in, we can capture the status of the sensors.
driver.get('http://{}/statuslive.html'.format(ipaddress))Periodically making HTTP / GET requests like the one shown, we will be able to get the HTML page to be parsed to extract the status information. I don’t dwell on the implementation of parsing, a simple Python string extraction exercise. The entire source code is available in the project repository.
Assuming we have a Python dictionary (firehose_record) with name and activation status of each sensor, we will be able to send it in JSON format to an AWS Kinesis Data Firehose stream previously configured to simply store the contents in an S3 bucket.
import boto3
import json

producer = boto3.client('firehose')

response = producer.put_record(
             DeliveryStreamName=os.environ['KINESIS_STREAM'],
             Record={
                     'Data': json.dumps(firehose_record) + '\n'
                    }
           )
Docker
To conclude, I have chosen to run the scraping script in a docker container: starting from the Python 3.8 image for ARM32 architecture, it’s required to install Firefox, Selenium and the related Gecko driver, as well as other dependencies.
The dockerfile used in the project is shown below.
AWS Glue
Now raw data is automatically collected in an S3 bucket. Let’s use it!
First we run an AWS Glue Data Catalog crawler to create a database (my-home) and a table (paradox_stream) that we can use in an ETL job.
Let’s start our Python script by showing just the schema identified by the crawler.
from pyspark.context import SparkContext
from awsglue.context import GlueContext

glueContext = GlueContext(SparkContext.getOrCreate())
paradox_stream = glueContext.create_dynamic_frame.from_catalog(
             database="my-home",
             table_name="paradox_stream")

print("Count: {}".format(paradox_stream.count()))
paradox_stream.printSchema()

Count: 493
root
|-- time: string
|-- area.1.Casa: int
|-- area.1.zone.Soggiorno: int
|-- area.1.zone.Cucina: int
|-- area.1.zone.Bagno_Vittorio: int
|-- area.1.zone.Camera_Bambini: int
|-- area.1.zone.Bagno_Ospiti: int
|-- area.1.zone.Camera_Vittorio: int
|-- area.1.zone.Porta_Ingresso: int
|-- area.1.zone.Tamper_Sirena: int
|-- area.1.zone.Garage: int
|-- area.1.zone.Porta_Garage: int
|-- area.1.zone.Giardino_Bagno: int
|-- area.1.zone.Giardino_Cucina: int
|-- area.1.zone.Giardino_Sala: int
|-- area.1.zone.Taverna: int
|-- area.1.zone.Fumo_Garage: int
|-- partition_2: string
|-- partition_1: string
|-- partition_3: string
|-- partition_0: string
Each motion sensor is represented in a column and can have different (integer) values depending on whether it is active or not.
Let’s take care now to write the ETL script that will allow us to process the data to identify two different entities: events and vectors.
Events
A single raw data record reports the status of each sensor at a specific timestamp. Our purpose is to identify the individual events, activation and deactivation, of each sensor and store them in a time series.
The following function does just that by eliminating the columns relating to sensors and adding a column to indicate any change from the previous observation.
The column shows the name of the sensor whose status has changed, followed by the suffix “UP” or “DOWN” depending on which variation is identified.
# List of events
def events(df):
    w = Window().orderBy(F.col("timestamp").cast('long'))
    change_column = None

    for column in sensors_list:
        activation = F.col(column).cast("long") > F.lag(column, 1)
                     .over(w)
                     .cast("long")
        activation = F.when(activation, F.lit(' {}-UP'.format(column)))
                     .otherwise(F.lit(''))

        deactivation = F.col(column).cast("long") < F.lag(column, 1)
                     .over(w)
                     .cast("long")
        deactivation = F.when(deactivation, F.lit(' {}-DOWN'.format(column)))
                     .otherwise(F.lit(''))

        if change_column is not None:
            change_column = F.concat(change_column, activation, deactivation)
        else:
            change_column = F.concat(activation, deactivation)

    df = df.withColumn('event', F.trim(change_column)).drop(*sensors_list)
    df = df.withColumn('event', F.explode(F.split('event',' ')))
    return df
By applying the function to our dataset, we get something similar.
df = paradox_stream.toDF()

# Cast to timestamp
df = df.withColumn("timestamp",
                   F.to_timestamp("time", "yyyy/MM/dd HH:mm:ss"))
                   .drop('time')

df_events = events(df)
df_events.show()

+----+-----------+-----------+-----------+-----------+-------------------+-------------------+
|Casa|partition_2|partition_1|partition_3|partition_0|          timestamp|              event|
+----+-----------+-----------+-----------+-----------+-------------------+-------------------+
|   9|         27|         10|         12|       2020|2020-10-27 12:27:53|                   |
|   8|         27|         10|         12|       2020|2020-10-27 12:27:55|Camera_Bambini-DOWN|
|   9|         27|         10|         12|       2020|2020-10-27 12:28:08|  Camera_Bambini-UP|
|   8|         27|         10|         12|       2020|2020-10-27 12:28:12|Camera_Bambini-DOWN|
|   9|         27|         10|         12|       2020|2020-10-27 12:28:17|       Soggiorno-UP|
|   8|         27|         10|         12|       2020|2020-10-27 12:28:19|     Soggiorno-DOWN|
|   9|         27|         10|         12|       2020|2020-10-27 12:28:21|  Bagno_Vittorio-UP|
|   8|         27|         10|         12|       2020|2020-10-27 12:28:24|Bagno_Vittorio-DOWN|
|   9|         27|         10|         12|       2020|2020-10-27 12:29:43|  Bagno_Vittorio-UP|
|   8|         27|         10|         12|       2020|2020-10-27 12:29:45|Bagno_Vittorio-DOWN|
|   9|         27|         10|         12|       2020|2020-10-27 12:29:49|  Bagno_Vittorio-UP|
|   8|         27|         10|         12|       2020|2020-10-27 12:29:52|                   |
|   8|         27|         10|         12|       2020|2020-10-27 12:29:54|Bagno_Vittorio-DOWN|
|   9|         27|         10|         12|       2020|2020-10-27 12:29:55|  Bagno_Vittorio-UP|
|   8|         27|         10|         12|       2020|2020-10-27 12:29:57|Bagno_Vittorio-DOWN|
|   9|         27|         10|         12|       2020|2020-10-27 12:30:07|          Cucina-UP|
|   8|         27|         10|         12|       2020|2020-10-27 12:30:10|        Cucina-DOWN|
|   9|         27|         10|         12|       2020|2020-10-27 12:30:23|          Cucina-UP|
|   8|         27|         10|         12|       2020|2020-10-27 12:30:25|        Cucina-DOWN|
|   9|         27|         10|         12|       2020|2020-10-27 12:30:37|          Cucina-UP|
+----+-----------+-----------+-----------+-----------+-------------------+-------------------+
only showing top 20 rows
Vectors
Once the events have been identified and reported on a time series, we can proceed to identify the vectors. By vector we mean a sequence of activation events (UP) occurring over a time window. For example, let’s imagine that a person moves around the house from one room to another: we will have two activation events related to the departure room and the destination room. We consider the vector concluded when no further activation events are detected within a certain predetermined time period (timeout).
The code used is the following.
# Find activation events vectors
timeout = 60 #seconds

w = Window().orderBy(F.col("timestamp").cast('long'))
begin_column = F.when(
                 F.lag('timestamp', 1).over(w).isNull(),
                 F.col('timestamp'))
               .otherwise(
                 F.when(
                   (F.col('timestamp').cast("long") -
                    F.lag('timestamp', 1).over(w).cast("long")
                   ) > timeout,
                   F.col('timestamp')
                 )
               )

df_vectors = df_events.filter(F.col('event').contains('-UP'))
                      .withColumn('begin', begin_column)
df_vectors = df_vectors.withColumn('begin', F.last('begin', True)
                       .over(w.rowsBetween(-sys.maxsize, 0)))
df_vectors = df_vectors.groupBy('begin')
                       .agg(F.collect_list("event")
                       .alias('vector'))

df_vectors.show()

+--------------------+--------------------+
|               begin|              vector|
+--------------------+--------------------+
|2020-10-27 12:28:...|[Camera_Bambini-U...|
|2020-10-27 12:29:...|[Bagno_Vittorio-U...|
|2020-10-23 09:01:...|[Camera_Vittorio-...|
|2020-10-23 09:14:...|[Camera_Bambini-U...|
|2020-10-23 09:16:...|[Camera_Bambini-U...|
|2020-10-23 09:21:...|[Soggiorno-UP, So...|
|2020-10-23 13:43:...| [Camera_Bambini-UP]|
|2020-10-23 15:59:...|[Camera_Bambini-U...|
|2020-10-23 16:01:...| [Camera_Bambini-UP]|
|2020-10-23 16:23:...|[Camera_Bambini-U...|
|2020-10-23 17:26:...|[Camera_Bambini-U...|
|2020-10-23 17:37:...|[Cucina-UP, Cucin...|
|2020-10-23 18:05:...|[Soggiorno-UP, Cu...|
|2020-10-23 18:09:...|[Cucina-UP, Cucin...|
|2020-10-23 18:28:...|      [Soggiorno-UP]|
|2020-10-23 18:39:...|[Soggiorno-UP, So...|
|2020-10-23 18:59:...|[Soggiorno-UP, So...|
|2020-10-23 19:01:...|[Soggiorno-UP, So...|
|2020-10-23 21:29:...|[Soggiorno-UP, So...|
|2020-10-23 21:31:...|[Bagno_Vittorio-U...|
+--------------------+--------------------+
only showing top 20 rows
We have obtained a table of only two columns, the start time (begin) of the vector and all the activation events in chronological order (vector).
Great! Let’s save JOB ETL results in an S3 bucket.
Viewing in Notebook
The time has finally come to view our data in a notebook.
First, we could make a heatmap to indicate the rooms with the most activations, using ETL job results.
glueContext = GlueContext(SparkContext.getOrCreate())
paradox_events = glueContext.create_dynamic_frame.from_catalog(
             database="my-home",
             table_name="paradox_events")
Let’s calculate the number of events grouped by type.
df_events_count = paradox_events.toDF()
                                .groupBy('event')
                                .count()
                                .toPandas()
df_events_count.set_index('event', inplace=True)
We use an image as the background of our heatmap and define the position of the rooms on it.
from PIL import Image
img = Image.open("./40-Large-2-Bedroom-Apartment-Plan.jpg")

rooms = { 'Camera_Vittorio': (32,75),
          'Camera_Bambini': (35,24),
          'Bagno_Ospiti': (15,30),
          'Bagno_Vittorio': (25,52),
          'Soggiorno': (58,75),
          'Cucina': (80,25)
        }
Last step, the visualization of our heatmap. For each room the XY position on the image is calculated and a point is drawn, whose dimensions depend on the number of occurrences. For this example, only activations are considered.
ticklx = np.linspace(0,100,5)
tickly = np.linspace(0,100,5)
xy2imgxy = lambda x,y: (img.size[0] * x / np.max(ticklx),\
                        img.size[1] * (np.max(tickly) - y) / np.max(tickly))
tickpx,tickpy = xy2imgxy(ticklx,tickly)

fig,ax = plt.subplots(figsize=(50,100))
ax.imshow(img)

# Rewrite x,y ticks lables
ax.set_xticklabels([])
ax.set_yticklabels([])

total = df_events_count['count'].sum()

# Add plot on the image.
for k in rooms:
    px,py = rooms[k]
    imgx,imgy = xy2imgxy(px,py)
    size = df_events_count.loc[k+'-UP']['count']/total*100
    ax.scatter(imgx,imgy,s=size*img.size[0],color="red",alpha=0.5)

# Adjust the axis.
ax.set_xlim(0,tickpx.max())
ax.set_ylim(tickpy.max(),0)

plt.show()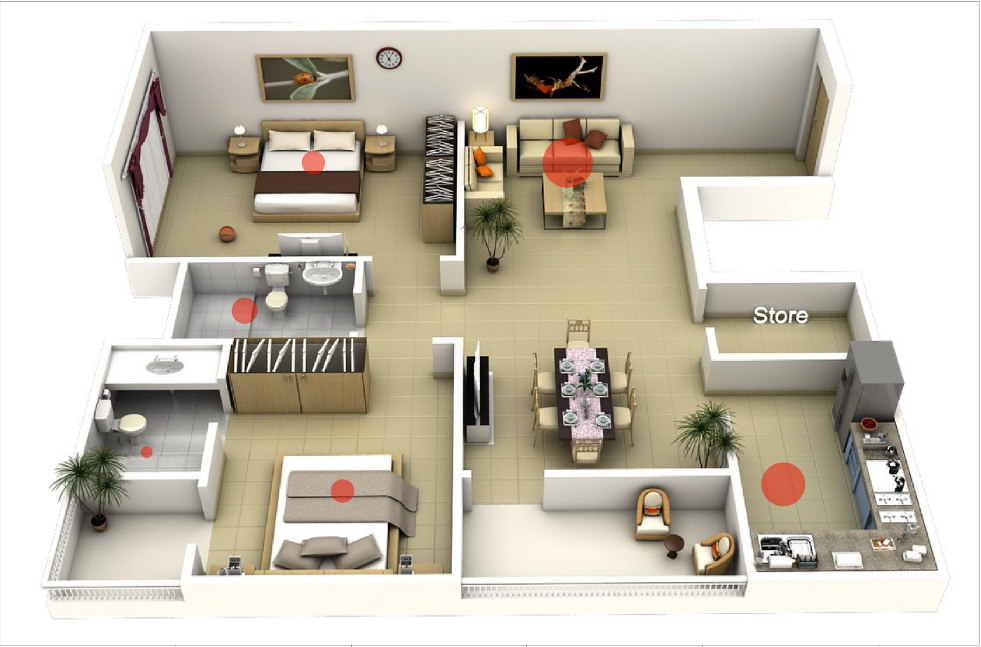
As I expected, the living room and kitchen are the most used rooms of my house.
Vectors
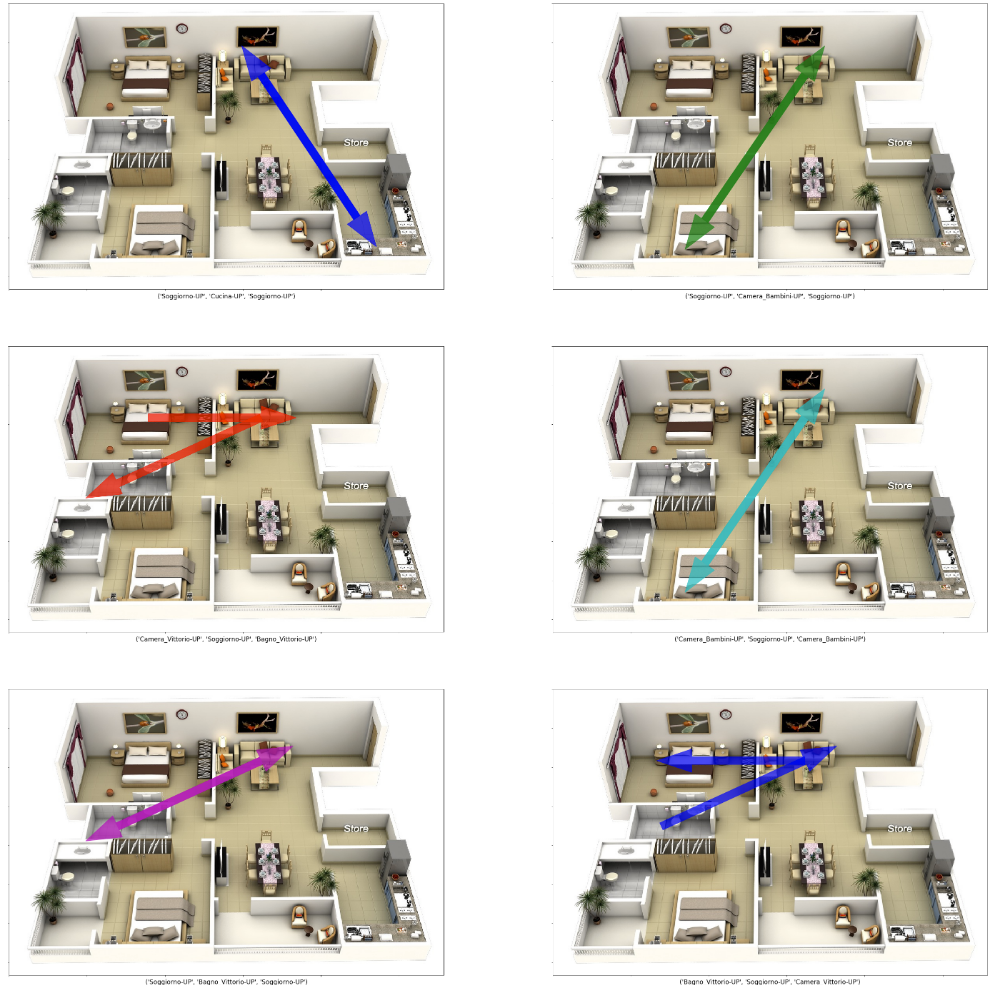
Now let’s take care of drawing the vectors on the floor plan of our house. To do this we need to identify the number of occurrences of each type of vector (same sequence of activations). We examine the most frequent vectors only. The full source code is available, as already mentioned, in the project repository.
The result is shown in the next figure.
Conclusions
This weekend project had no application in the professional field. It was born with the purpose of:
- evaluate the potential of @edge scraping, on the Raspberry PI platform.
- become familiar with the creation of a data pipeline, collecting and processing data with AWS with Kinesis Data Firehose and Glue
- have fun analyzing home travel habits!
Project evolution? Can we use collect data to train machine learning models? For example to:
- determine how many people or even identify which people are in the house?
- identify anomalies and report events even when our alarm system is deactivated?
Maybe next weekend! We had fun? See you next time!